sebastiandaschner blog
Discover applications running on Kubernetes with Prometheus
friday, february 15, 2019Prometheus supports scraping multiple application instances. Applications that run in orchestrated environments require to be discovered dynamically, since their IP addresses will change. Prometheus can be configured to use the Kubernetes API to discover changes in the list of running instances dynamically.
The following shows a minimalistic Prometheus example of instrumenting an application with multiple pod instances.
Prometheus configuration
We configure Prometheus to discover the pods of our config-example application.
global:
  scrape_interval:     15s

  external_labels:
    monitor: 'example-monitor'

scrape_configs:
- job_name: 'example-metric'
  scrape_interval: 5s

  metrics_path: /metrics/
  scheme: https
  basic_auth:
    username: admin
    password: adminadmin
  tls_config:
    insecure_skip_verify: true


  kubernetes_sd_configs:
  - role: endpoints
    namespaces:
      names:
      - default

  relabel_configs:
  - source_labels: [__meta_kubernetes_service_label_app]
    separator: ;
    regex: config-example
    replacement: $1
    action: keep
  - source_labels: [__meta_kubernetes_endpoint_port_name]
    separator: ;
    regex: https
    replacement: $1
    action: keep
  - source_labels: [__meta_kubernetes_namespace]
    separator: ;
    regex: (.*)
    target_label: namespace
    replacement: $1
    action: replace
  - source_labels: [__meta_kubernetes_pod_name]
    separator: ;
    regex: (.*)
    target_label: pod
    replacement: $1
    action: replace
  - source_labels: [__meta_kubernetes_service_name]
    separator: ;
    regex: (.*)
    target_label: service
    replacement: $1
    action: replace
  - source_labels: [__meta_kubernetes_service_name]
    separator: ;
    regex: (.*)
    target_label: job
    replacement: ${1}
    action: replace
  - separator: ;
    regex: (.*)
    target_label: endpoint
    replacement: https
    action: replace
We need to adjust the app label (here config-example) and the port name (https) under which the monitoring endpoint is available.
Instrumented application
This example uses the MicroProfile Metrics endpoint that runs on top of Open Liberty.
The application exposes the metrics in the Prometheus format under port 9443 and path /metrics/.
Here you can see an example service and deployment:
kind: Service
apiVersion: v1
metadata:
  name: config-example
  labels:
    app: config-example
spec:
  selector:
    app: config-example
  ports:
  - port: 9443
    name: https
  - port: 9080
name: httpkind: Deployment
apiVersion: apps/v1beta1
metadata:
name: config-example
spec:
replicas: 2
template:
metadata:
labels:
app: config-example
spec:
containers:
- name: config-example
image: sdaschner/config-example:1
# ...You can find the full example including the running application on GitHub.
Prometheus setup & RBAC
In order to make the example work for a RBAC Kubernetes setup, the Prometheus service account needs to have the correct permissions. Therefore, we create a service account and corresponding cluster roles as included in the YAML definitions here. Similarly, we specify the service account when creating the Prometheus deployment.
We create a deployment and service for our Prometheus instance.
kind: Service
apiVersion: v1
metadata:
  name: prometheus
  labels:
    app: prometheus
spec:
  selector:
    app: prometheus
  ports:
  - port: 9090
name: httpkind: Deployment
apiVersion: apps/v1beta1
metadata:
name: prometheus
spec:
replicas: 1
template:
metadata:
labels:
app: prometheus
version: v1
spec:
serviceAccountName: prometheus
containers:
- name: prometheus
image: prom/prometheus:v2.7.1
ports:
- containerPort: 9090
volumeMounts:
- name: prometheus-config-volume
mountPath: /etc/prometheus/prometheus.yml
subPath: prometheus.yml
volumes:
- name: prometheus-config-volume
configMap:
name: prometheus-config
restartPolicy: AlwaysThe configuration shown earlier can be injected into the instance from a config map.
kind: ConfigMap
apiVersion: v1
metadata:
  name: prometheus-config
data:
  prometheus.yml: |
    global:
      scrape_interval:     15s
      # content as shown earlier ...
For a full explanation on the Prometheus configuration, have a look at the documentation.
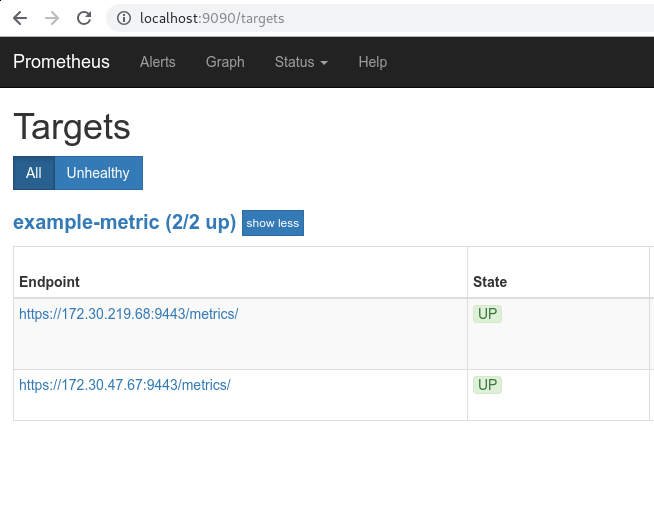
Accessing the targets
The running Prometheus instance can now discover both running config example applications which run as Kubernetes pods:
$> kubectl get pods
NAME                                 READY     STATUS    RESTARTS   AGE
config-example-69974cbc96-dqd96      1/1       Running   0          4m
config-example-69974cbc96-zstg7      1/1       Running   0          4m
grafana-8694db9d4f-nvn5s             1/1       Running   0          3m
prometheus-594dd9cdb8-95ftz          1/1       Running   0          3m
We can see the actual targets including their IP address under the Prometheus configuration.
Have a look at the full example on GitHub (deployment/ directory).
You might also see the following video how to implement business metrics in Java EE applications using MicroProfile.
For more complex microservice examples that define many more applications, this approach using the plain Prometheus configuration might be a bit cumbersome. To minimize boilerplate code, developers can use solutions that abstracts away the lower-level configuration, such as Prometheus Operator. In the next post we’ll see how Prometheus Operator facilitates the configuration of applications.
Happy monitoring!
Found the post useful? Subscribe to my newsletter for more free content, tips and tricks on IT & Java: